


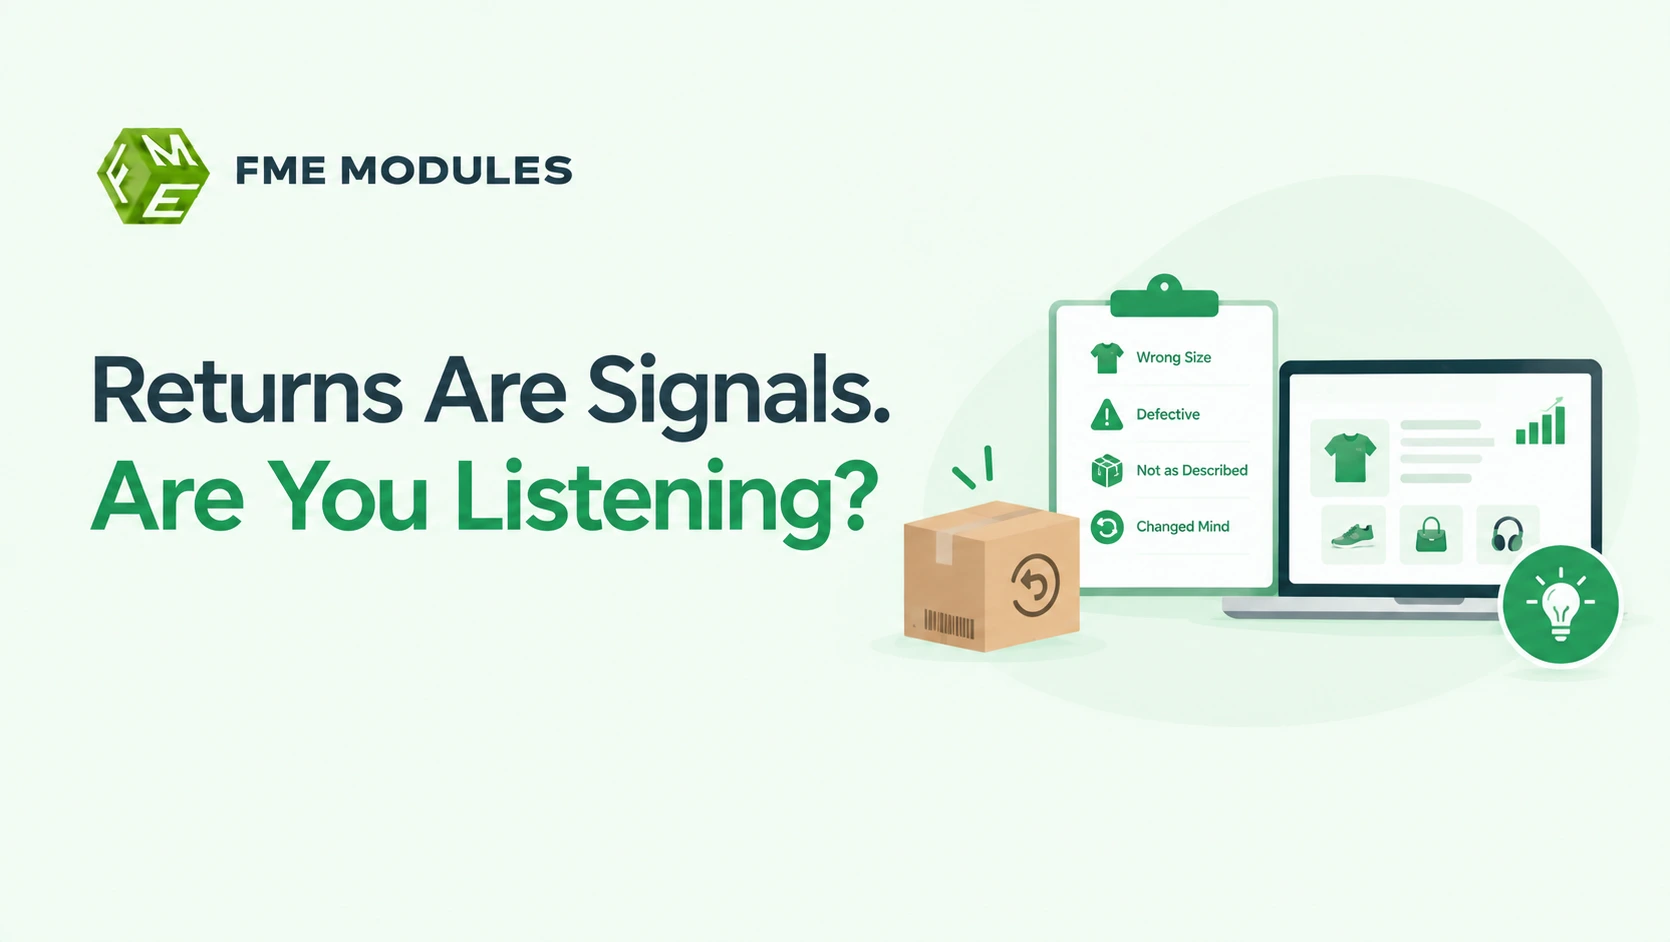
Product returns are more than just a cost for your ecommerce business. They can reveal problems with product descriptions, images, sizing information, or customer expectations that may be affecting buying decisions.
By understanding why customers return products, you can identify weaknesses in your catalog and make better improvements. Let’s explore what your return data can tell you and how to use these insights to improve your PrestaShop store.
Why Product Returns Matter More Than You Think
Returns affect more than your bottom line. They can influence inventory planning, customer satisfaction, fulfillment costs, and the overall shopping experience.
For example, if customers repeatedly return the same product because it looks different from the images, the problem may not be the product itself. Your photography may be creating expectations that the actual item cannot meet.
Similarly, if a particular clothing item generates frequent size-related returns, the issue could be an inconsistent size chart or insufficient information about fit.
These patterns matter because they point to problems you can potentially fix before another customer places an order.
Product return data can help you answer questions such as:
- Are customers receiving what they expect based on your product pages?
- Which products generate the most avoidable returns?
- Are certain categories affected by recurring sizing, quality, or compatibility issues?
- Do customers have enough information to make confident purchasing decisions?
- Which catalog improvements could have the greatest impact on the customer experience?
Instead of simply tracking how many products come back, you can use returns to understand why customers are dissatisfied and where your catalog needs improvement.
1. High Return Rates Can Reveal Inaccurate Product Descriptions
Your product description is one of the primary ways customers evaluate an item before purchasing it. When that description is incomplete, unclear, or misleading, customers may develop expectations the product cannot meet.
Imagine an online store selling a compact coffee machine. The product page describes it as ideal for small kitchens but does not clearly list its dimensions. After delivery, customers discover that it occupies more counter space than expected.
The machine may work perfectly, yet customers still return it because the product page did not provide enough information.
This is a catalog problem, not necessarily a product problem.
Look for return reasons such as:
- Not as described.
- Different from expectations.
- Smaller or larger than expected.
- Missing features.
- Incorrect specifications.
If these reasons appear repeatedly for a particular product, review its description carefully.
Does it clearly explain the product's dimensions, materials, features, limitations, and intended use? Are important details buried in long paragraphs? Are technical specifications missing or difficult to find?
What to do: Rewrite descriptions to prioritize the information customers need to make a purchase decision. Include precise measurements, relevant specifications, compatibility requirements, and realistic explanations of what the product can and cannot do.
The goal is not to make every product sound more appealing. It is to help customers understand exactly what they are buying.
2. Product Images May Be Creating the Wrong Expectations
Images often communicate more than written descriptions. Customers use them to judge a product's size, color, texture, finish, shape, and overall quality.
When images do not accurately represent the product, even a well-written description may not prevent disappointment.
For example, a furniture retailer might photograph a sofa in a spacious studio with carefully positioned lighting. Without contextual dimensions or close-up images, customers may assume it is larger or made from a different fabric than it actually is.
A cosmetics brand might also experience returns when product colors appear noticeably different on the website than they do in person.
These problems become easier to identify when you compare return reasons across products and review the imagery associated with frequently returned items.
Consider whether your catalog includes:
- Multiple angles that show the product clearly.
- Close-up images of important materials or details.
- Lifestyle images that provide realistic context.
- Scale references or dimensions where appropriate.
- Accurate color representation.
- Images showing what is included in the purchase.
What to do: Improve the images on products with recurring appearance-related returns. Add contextual photography, close-ups, and visual size references where they help customers make better decisions.
For products where color accuracy is particularly important, review the consistency of photography, lighting, and image editing.
Better imagery can help customers make more informed choices before checkout, reducing the likelihood of unpleasant surprises after delivery.
3. Sizing and Fit Issues Can Expose Gaps in Your Catalog
Sizing-related returns are common in categories such as clothing, footwear, accessories, and furniture. However, the underlying problem is not always that customers selected the wrong size.
Sometimes, the catalog does not provide enough information to help them choose correctly.
A customer buying running shoes may need more than a standard size chart. They may want to know whether the shoes run narrow, whether the toe box is spacious, or how the fit compares with other models.
Similarly, someone purchasing a jacket may need guidance on whether it is designed for a slim, regular, or oversized fit.
Without this information, customers are left to guess.
Repeated returns associated with sizing can therefore reveal that your catalog is missing important decision-making details.
To investigate, examine whether:
- Specific sizes generate disproportionately high return rates.
- Customers frequently report that products run large or small.
- Similar products have inconsistent measurements.
- Size charts are missing or difficult to interpret.
- Product descriptions fail to explain fit or intended use.
What to do: Add detailed size guides, garment measurements, fit descriptions, and practical selection advice. Where appropriate, include model measurements and the size worn in product photography.
For furniture, provide clear dimensions and guidance on measuring the intended space. For footwear, explain fit characteristics and any relevant sizing considerations.
The more effectively your catalog answers sizing questions, the less customers need to rely on guesswork.
4. Compatibility Returns May Signal Missing Technical Information
Some returns happen because customers purchase a product that does not work with something they already own.
This is especially relevant to electronics, computer accessories, replacement parts, automotive products, and other items with specific compatibility requirements.
Consider a customer who purchases a laptop docking station expecting it to support multiple external monitors. The product page lists the available ports but does not clearly explain the display limitations associated with different laptop models.
After receiving the item, the customer discovers that it cannot perform as expected with their setup.
The product may be functioning correctly, but the catalog has failed to communicate a critical limitation.
Compatibility-related return reasons may include:
- Does not fit.
- Not compatible with my device.
- Wrong connector or size.
- Missing required accessories.
- Does not support the expected functionality.
What to do: Make compatibility information easy to find and understand. Include supported models, connection requirements, dimensions, operating system requirements, and any necessary accessories.
Where the catalog contains many similar products, consider adding comparison charts or compatibility filters to help customers narrow down their choices.
This is particularly valuable when two products look nearly identical but differ in specifications that materially affect how they work.
5. Repeated Quality Complaints Can Identify Product-Level Problems
Not every return can be solved by improving a product page. Sometimes, return data points to a genuine issue with the product itself.
Customers may report broken components, inconsistent materials, poor finishing, defective items, or products that fail during normal use.
When several customers report similar problems with the same product, it is worth investigating whether the issue is isolated or part of a larger pattern.
For example, a home goods retailer might notice that customers frequently return a particular kitchen appliance because its handle becomes loose after a short period of use.
Changing the product description will not solve the underlying problem. The business may need to investigate manufacturing quality, supplier consistency, packaging, or shipping damage.
Return data can help identify:
- Products with unusually high defect-related returns
- Recurring complaints about the same component
- Differences in return rates between suppliers or batches
- Products that consistently fail to meet customer expectations
- Issues that emerge shortly after a product launch or supplier change
What to do: Combine return reasons with product identifiers, supplier details, batch information, and customer feedback. Escalate recurring defects to the appropriate product, procurement, or quality assurance team.
You should also distinguish between a defective product and a product that is unsuitable for a customer's needs. The corrective action will be different for each.
6. Return Patterns Can Reveal Which Product Categories Need Attention
Looking at individual products is useful, but broader catalog patterns can reveal opportunities that are less obvious at the product level.
For instance, a store might discover that clothing products generate frequent fit-related returns, while electronics products are more often returned because of compatibility issues.
These categories need different solutions.
Clothing pages may benefit from better fit guidance and measurements. Electronics pages may need more detailed technical specifications and compatibility information.
Analyzing returns by category, brand, supplier, product type, and return reason helps you determine whether a problem is isolated or widespread.
It can also help you prioritize your work.
If a single product has a high return rate but accounts for very few orders, its overall impact may be limited. Another product with a moderately elevated return rate and thousands of orders could represent a much larger opportunity for improvement.
What to do: Group return data into meaningful segments and compare patterns across the catalog. Look for recurring problems that affect multiple products, rather than treating every return as a separate case.
This allows your team to identify improvements that can benefit an entire category instead of updating product pages one at a time without a clear strategy.
7. Return Reasons Can Show You What Information Customers Are Missing
Customers often explain their returns in simple terms: the product was too complicated to use, the material felt different than expected, the instructions were unclear, or an essential accessory was missing.
Although these comments may appear minor, they can reveal information gaps throughout your catalog.
For example, customers returning a home security camera because setup was more complicated than expected may need clearer installation requirements and a more realistic explanation of the setup process.
Customers returning a skincare product because it did not suit their needs may benefit from clearer information about its intended use, ingredients, or appropriate skin types.
The important distinction is between information customers could reasonably have used before buying and problems that only become apparent after the product is used.
What to do: Review customer comments alongside standardized return reasons. Identify recurring questions and turn the answers into useful catalog content.
Depending on the product, this might mean adding:
- Frequently asked questions.
- Installation or setup requirements.
- Care and maintenance instructions.
- Material and ingredient details.
- Clear explanations of product limitations.
- Guidance on who the product is and is not suitable for.
Your product catalog should help customers understand not only what a product is, but also whether it is right for their particular needs.
How to Analyze Product Returns for Catalog Insights
You do not need an elaborate analytics system to start identifying useful patterns. A structured approach to collecting and reviewing return data can reveal meaningful opportunities.
Here is a practical process to follow.
Step 1: Standardize Your Return Reasons
Start by creating consistent return categories across your store.
These might include inaccurate description, appearance mismatch, sizing or fit, compatibility, product defect, damaged delivery, missing components, and customer preference.
Allow customers to provide additional comments when necessary.
Standardized reasons make it easier to compare products and identify recurring issues. However, avoid forcing every return into an inaccurate category. An "other" option and a space for additional details can help preserve useful context.
Step 2: Connect Returns to Specific Products
Each return should be associated with the relevant product identifier, such as its SKU, along with the product category and other useful attributes.
Where available, connect return records to the product page version, supplier, order date, and relevant fulfillment details.
This helps you distinguish catalog-related issues from problems caused by fulfillment, damage in transit, or other operational factors.
Step 3: Calculate Return Rates Correctly
The number of returns alone does not tell you whether a product has a problem.
A product with 100 returns from 10,000 orders has a different return profile from one with 30 returns from 100 orders.
A simple starting point is:
Product return rate = (Units returned ÷ Units sold) × 100
For example, if a product sells 500 units and 40 units are returned, its unit return rate is 8%.
Use consistent time periods and clearly define what counts as a return. Consider the return window, delayed returns, and whether you are measuring units or orders. For multi-item orders, unit-based and order-based return rates can tell different stories.
Where possible, compare similar products and categories rather than applying a single benchmark to your entire catalog.
Step 4: Identify the Most Common Return Reasons
Once return rates are calculated, break them down by reason.
A product with an 8% return rate might have a relatively low number of defect-related returns but a high number of returns caused by inaccurate expectations.
That distinction matters. A catalog update may address the second issue, while the first may require quality assurance or supplier intervention.
Look at both the frequency of each reason and its share of all returns.
Step 5: Prioritize the Most Valuable Improvements
Not every issue deserves the same level of attention.
Prioritize products with high return rates, meaningful sales volume, recurring customer complaints, or substantial avoidable return costs.
Then identify the most appropriate corrective action: updating a description, improving imagery, adding specifications, clarifying sizing, or escalating a product quality concern.
Step 6: Measure What Changes After the Update
After making an improvement, monitor the relevant return rate and return reasons over a suitable period.
Compare results with the previous period while accounting for changes in sales volume, seasonality, product mix, and other factors that could affect returns.
Also track customer satisfaction, product-page conversion, support inquiries, and refund or handling costs where relevant.
This helps you determine whether the update improved the customer experience without creating unintended problems.
Which Metrics Should You Track?
A useful return analysis combines several metrics rather than relying on one headline number.
|
Metric |
What it tells you |
|---|---|
|
Product return rate |
How frequently a product is returned relative to sales |
|
Return reason distribution |
Which problems account for the most returns |
|
Category return rate |
Whether specific product categories have recurring issues |
|
Defect-related return rate |
How often products are returned because of reported quality problems |
|
Return cost per product |
The financial impact of returns, including relevant processing costs |
|
Repeat customer return rate |
Whether returning customers frequently send products back |
|
Post-update return rate |
Whether catalog or product improvements are associated with fewer returns |
Use these metrics together to understand both the scale of a problem and its likely cause.
For example, a high return rate combined with frequent "not as described" feedback points toward a different investigation than a high return rate dominated by damaged products.
Also remember that return data can be affected by the length of your return window, customer behavior, and reporting delays. Allow enough time for returns to mature before drawing conclusions about recent changes.
Common Mistakes to Avoid When Analyzing Returns
Even when businesses collect detailed return data, a few common mistakes can limit its usefulness.
Focusing only on total return volume. High sales volume naturally creates more opportunities for returns. Compare return rates and absolute costs together.
Assuming every return is a catalog problem. Damaged shipments, manufacturing defects, and changing customer preferences may require operational or product-level solutions instead.
Ignoring customer comments. Standardized return codes make analysis easier, but written feedback can explain the context behind a problem.
Making changes based on too little data. A handful of returns may not establish a reliable pattern, especially for low-volume products. Look for repeated evidence and investigate serious issues promptly.
Updating product pages without measuring the results. An improvement should be evaluated against clear metrics rather than assumed to be successful.
Trying to eliminate every return. Some returns are legitimate and unavoidable. The objective is to reduce preventable returns while helping customers find products that genuinely meet their needs.
Turning Return Data Into a Better Shopping Experience
Your product catalog is more than a collection of descriptions, images, and specifications. It is a decision-making resource that helps customers determine whether an item is right for them.
When that resource leaves important questions unanswered, customers may make purchases based on incomplete or incorrect expectations. Returns then become one of the clearest signals that something in the buying experience needs attention.
By connecting return reasons to specific products, examining recurring patterns, and improving the information customers see before checkout, you can make your catalog more useful and accurate.
The process does not end with a single round of updates. Customer expectations evolve, products change, and new issues emerge. Regularly reviewing return data helps your team keep product information aligned with what customers actually experience.
Ultimately, the goal is not simply to process fewer returns. It is to help customers make better purchasing decisions from the start.
The best product return strategy begins long before a customer clicks the buy button.